As we wrap up a content-heavy 2012, we decided it’s time to dig deeper into the differences in how our readers consume content on desktop versus mobile devices. We know that mobile is more than a carbon copy of the traditional website — but we also know that generalized knowledge alone doesn’t make for informed optimization decisions.
To jump into this study, we started out with several questions about the visitors that access our site via mobile device:
- At what moment of the day do they visit?
- What types of content do they favor?
- What on-site features will help them make the most of their visit?
- Are they less likely to convert?
This data obviously can’t serve as a rule for how all mobile traffic behaves, but should rather be viewed as a case study examining the differences in how mobile and desktop users consume B2B content.
Mobile vs. desktop visitors
Like the vast majority of sites across the web, we watched our mobile traffic grow steadily throughout the year. We rounded out 2012 with just shy of 20% of traffic coming from mobile devices. 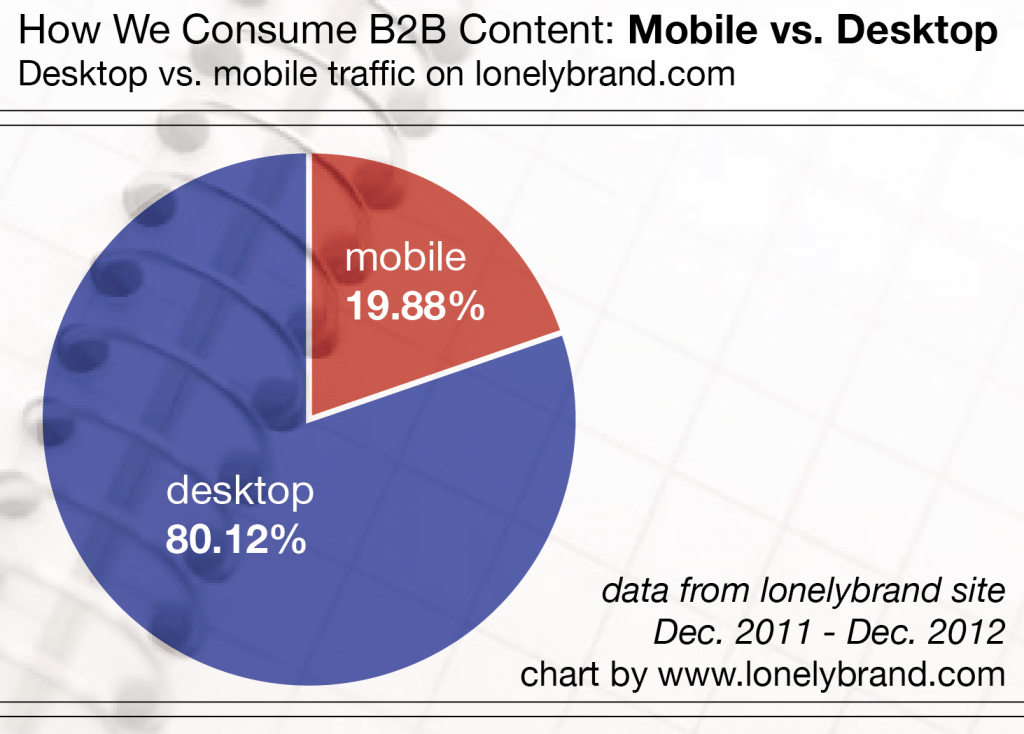 Mobile Insights: At this point, it’s too late to call mobile a trend. Instead, it’s a reality that we must face as both content creators and marketers. Twenty percent is a substantial portion of our audience that will only continue to expand in 2013 – and their browsing preferences cannot be ignored.
How do mobile users browse the web?
Between applications, screen size and general state of mind, we have different habits when browsing the web from a smartphone or tablet. To better understand the desktop versus mobile web browsing process, we took a look at our site’s referral sources.
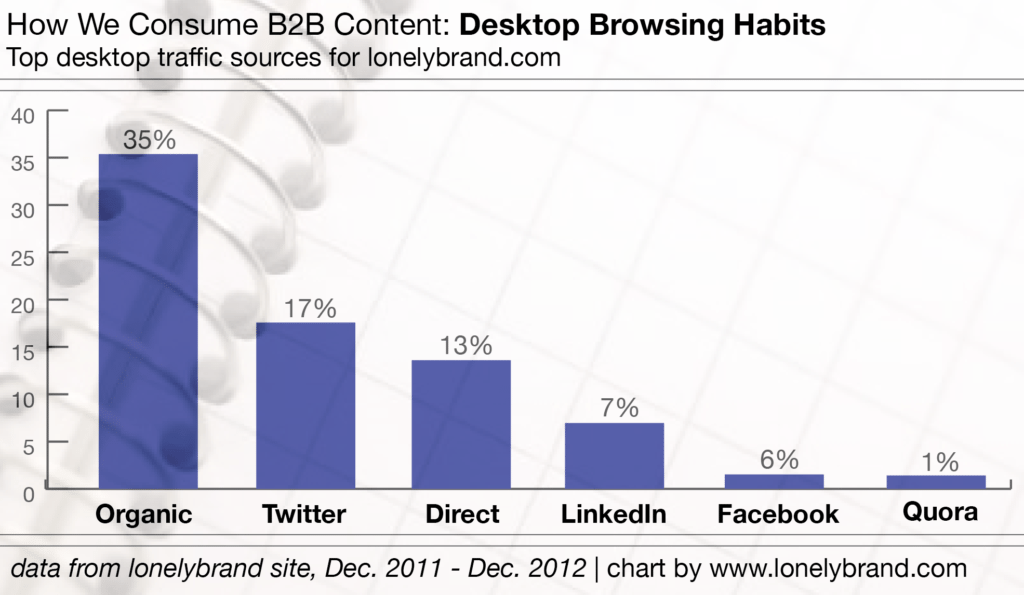
Over a third of our desktop traffic comes from organic search, meaning that they head to their search engine of choice to find whatever it is they’re looking for. Maybe it’s about a topic we’ve covered, or maybe they search for the company itself. Behind search, Twitter is our second largest driver of desktop traffic, followed by direct traffic (more on that later) and several social networks.
Our traffic referral chart for mobile visitors looks dramatically different. Half of our mobile traffic falls under “direct,” meaning that Google Analytics isn’t quite sure where it came from – visitors could have typed in the URL, accessed the link via bookmarks, clicked on an email footer, or a multitude of other referral possibilities. Just 19% of our mobile traffic comes from search. Our other top mobile traffic drivers are social networks, including this year’s buzzworthy network, Pinterest.
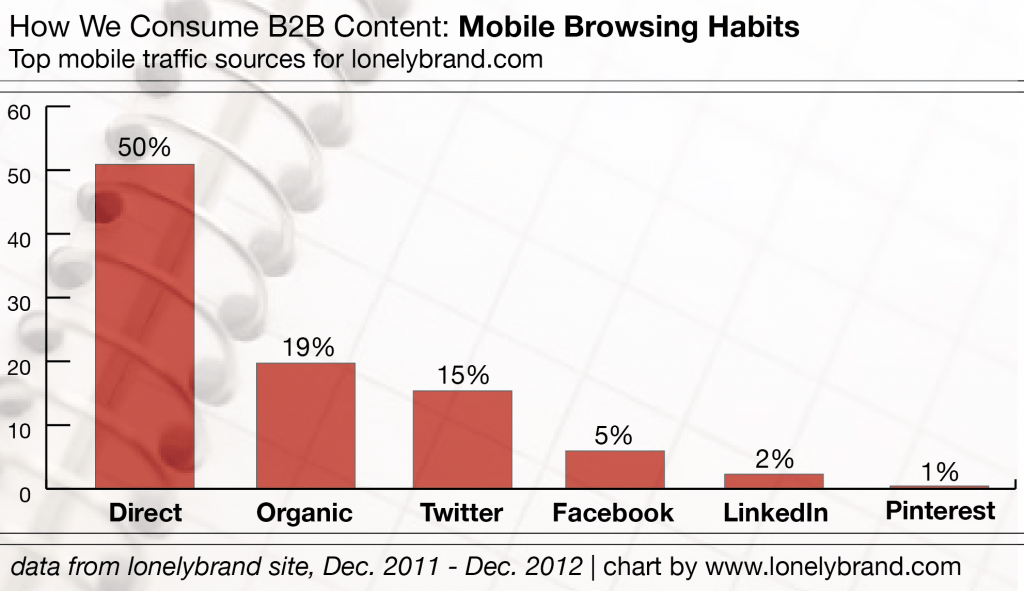
Mobile Insights: With a significant fraction of our mobile traffic being “direct,” we’re left with a bit of mystery as to where people actually came from. There are a number of tools we could use to glean insights on these visitors, including both Google Webmaster Tools and Google’s URL Builder, which can be used to add source code to links before sharing across the web.
When do mobile users browse the web?
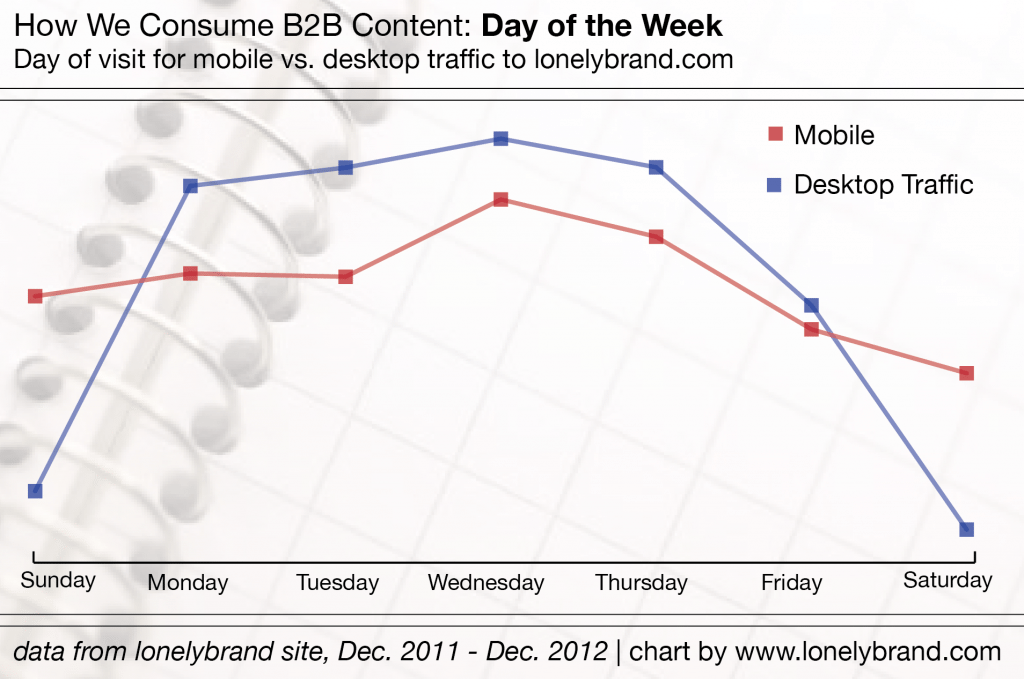
The vast majority of lonelybrand’s traffic happens Monday through Thursday, hinting that people are looking at our content in the office. We see very little desktop traffic on Saturday and Sunday, and traffic significantly drops on Friday as our visitors check out for the weekend.
On the other hand, mobile traffic has a fairly even spread across the week. While Wednesday is always our busiest day, Saturday and Sunday manage to carry their weight on mobile devices. This means our mobile content is often viewed in non-work situations – the bus, the bar, bed, etc.
Top visit times for mobile traffic mirror those of desktop traffic, but with less extreme peaks. We see a huge burst in traffic at 10 am from desktop computers, but the spread is fairly even for mobile during waking hours – about 8am to 10pm.
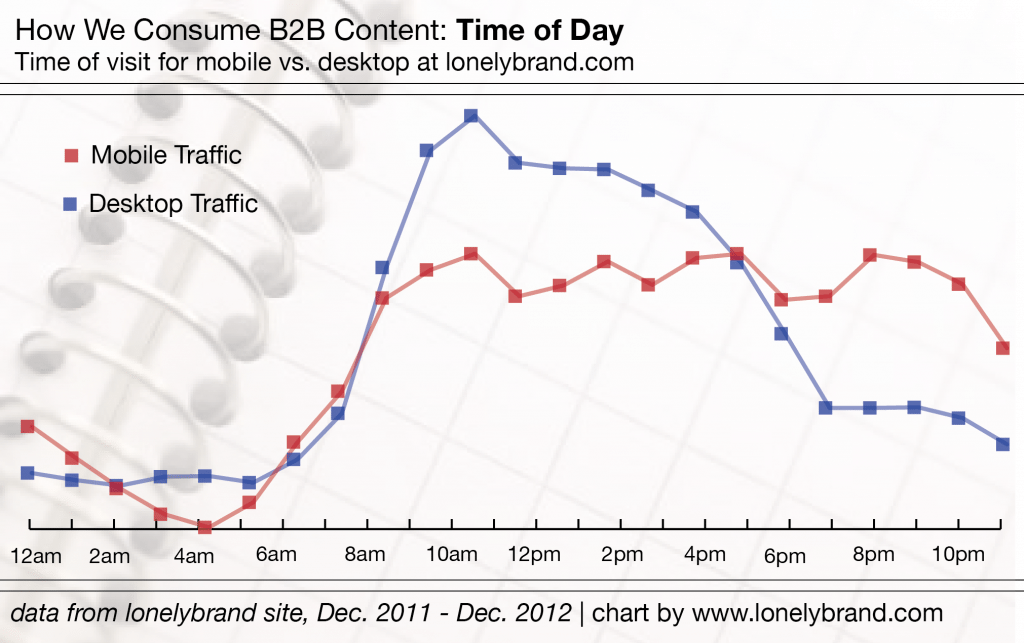
Mobile Insights: While desktop visits happen for the most part during working days and hours, mobile visits happen throughout the day and week. It’s important to keep in mind that these visitors are subject to a number of distractions, and need to find what they’re looking for as quickly as possible.
What kind of content do they prefer?
Do people flock to different types of content depending on the device used? For the most part, this doesn’t seem to be true for our site – there was a good amount of overlap among top posts for desktop and mobile visitors. We did however, notice that desktop visitors tend to visit pages that offer a browsing-based experience – the homepage, blog homepage and category pages all list content and ultimately point to various internal pages. Mobile users, on the other hand, head to specific pieces of content.
Top 5 Pages for desktop users
- lonelybrand Homepage
- How to Add Instagram to Your Brand’s Facebok Page
- lonelybrand Blog Homepage
- Best Landing Page Designs Category Page
- Top 10 Ways Millenials Self-Sabotage Careers
Top 5 posts for mobile users
- Top 10 Ways Millenials Self-Sabotage Careers
- Futurama Embraces Memes for Season Premiere Ads
- lonelybrand Homepage
- How to Add Instagram to Your Brand’s Facebook Page
- Kidnapped Chicagoan Campaign Sends Transit Riders to Social Media of the Minute
How deep are they willing to dig?
We took a closer look at the average number of pages per visit to see whether users read a piece of content and leave or continue exploring. This experience is fairly similar between desktop and mobile – desktop visitors are only slightly more likely to continue browsing through content.
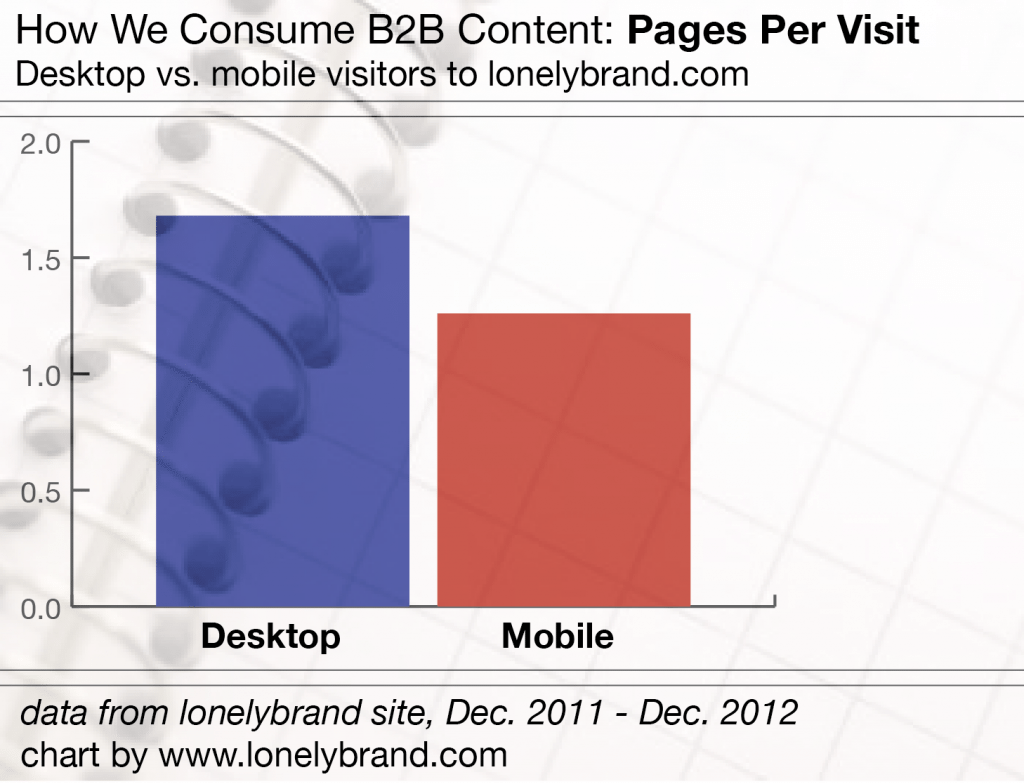
Mobile Insights: Hyperlinks are not the most touch-friendly feature, so it shouldn’t be the only strategy we rely on for mobile content. Here we need to consider new, non-disruptive strategies for sharing related content with mobile visitors.
Do they convert?
Conversion is the end-all-be-all of content marketing, so we couldn’t withhold this data point. Here we highlighted one important action: white paper downloads. As you can see, desktop conversion is significantly more common than mobile conversion.
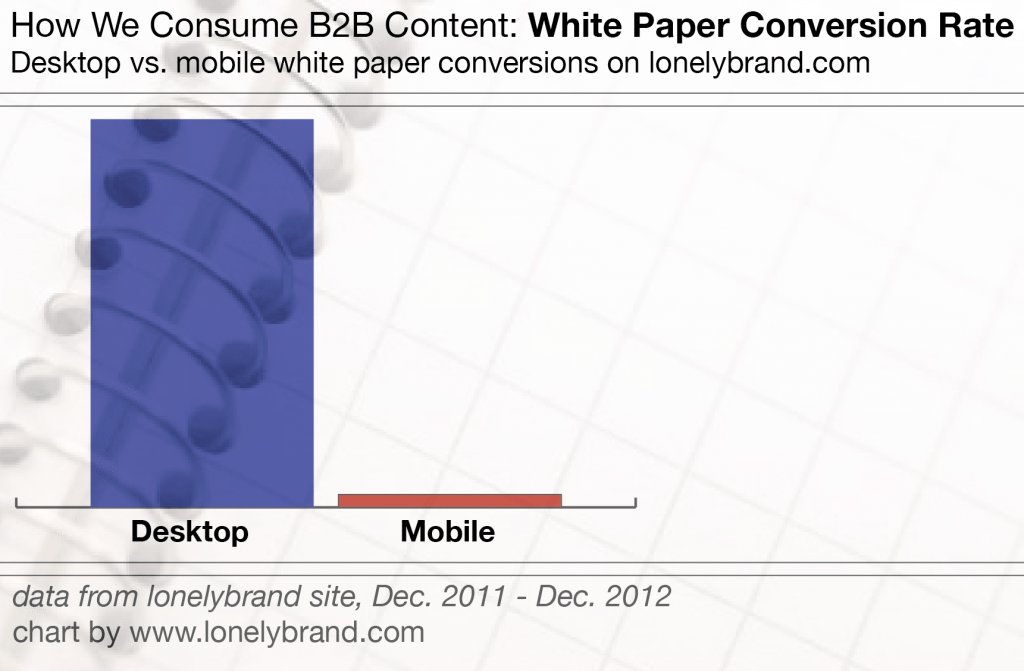
Mobile Insights: The issue here could be that mobile users want to quickly read articles, not download content. But that can’t be the whole story; to fully understand what’s happening, we’ll have to dig deeper into the data. From minimizing landing page text to optimizing form fields for mobile, the solution lies in a testing-based trial and error process.