
Research has shown time and again that visual elements are more effective than solely textual elements. In fact, when it comes to communicating data, high quality infographics are 30 times more likely to be read than text articles, and publishers that feature infographics grow traffic 12% faster than publishers that don’t. Add to that the fact that infographics are inherently shareable and lend themselves well to the realm of social media, and it’s obvious that brand marketers should be quick to embrace them. Of course, you may not have a creative staff on hand to help you create them on a regular basis, but your problem could be solved with Infogram.
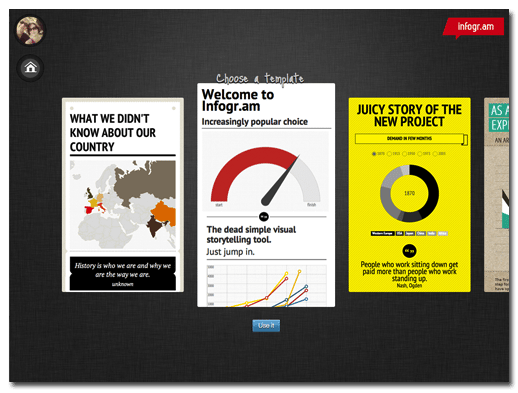
Infogram allows you to take your research and quickly and easily turn it into an attractive, easy to read infographic. Begin with a template, to which you can add charts, maps, pictures, even video, to help you make a professional infographic that is sure to get some attention. You can even forego infographics altogether and just use the site to create a clean and simple chart.
If you don’t know where to start, you can also find inspiration from Infogram’s featured submissions.
Ready to get started? Learn how to create a fun, effective infographic in just four steps with our helpful guide.