
 A few weeks back Pocket introduced an analytics dashboard for publishers. Sure, the tool offers a fresh persepctive on deferring content, but with this and any new analytics tool it’s important to avoid what Avinash Kaushik calls data puking: pulling numbers upon numbers that lack any real analysis or meaning. What can we actually learn from the Pocket for Publishers dashboard? How can we use this data to improve the reader’s experience and ultimately boost our conversions? After experimenting with the tool for a week, here are a few initial thoughts.
% Saved Items Opened
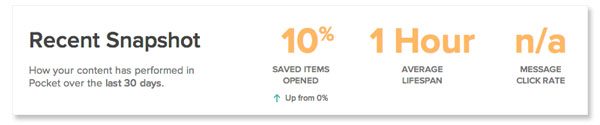
What is it? This metric refers to the percentage of people who opened content after it was saved. Sure, people are saving your articles, but are they actually going back and reading them? Ideally, a visitor will click on your article and read it right then and there. But we’re all busy, and many resort to save-it-for-later apps. It’s up to us as publishers to adapt to this consumption habit.
How can we improve it? For the past 30 days, our average Saved Items Opened rate clocked in at 10%, meaning that for every 10 pieces of our content saved, one of those people came back to read the article. To improve this metric, we’re experimenting with repetition. Guy Kawasaki recommends repeating tweets because “the assumption that everyone who is interested in your posts will see it the first time is naïve.” But what about repeating tweets as a friendly reminder to those who may have saved but forgotten about your content? There’s a thin line between helpful repetition and annoyance, and ultimately the data will show which side our experiment lands on.
Top Content
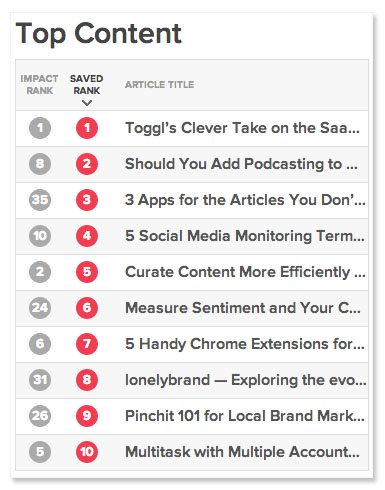
What is it? You can view Top Content according to Saved Rank, which is a straightforward list determined by number of saves. You can also check out Impact Rank, which Pocket describes as “ranking according to loyalty and quality.” Sounds important, but since I don’t know exactly how it’s calculated, it reminds me of Facebook’s convoluted “People Talking About This” metric — so I’ll avoid it for now.
How can we improve it? Saved Rank data should feed directly into editorial calendar planning. Take a close look at the content that topped your saved rank, then identify common elements among these items. What makes visitors decide that this content is worth coming back for? Figure out what that is, and fill your editorial calendar with more of it.
Footer Message Click-Through Rate
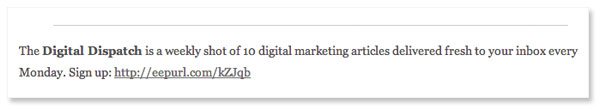
What is it? Custom Footer Messages appear at the bottom of saved articles when viewed within the Pocket app. So while the rest of your site elements are stripped away, you can add this simple call to action. The metric itself lets you know whether anyone actually clicked on that message.
How can we improve it? We kicked things off with one footer message, which invited users to sign up for the Digital Dispatch, our weekly content-packed email. Our Footer Message has existed for a mere four days, and our click-through rate is currently non-existent. From here, the plan is to collect more data on how users interact with this feature, experimenting with various calls to action including links to related blog posts and white papers. That may do the trick, or at the end of the day we might find that these footer messages are not worth our time at all.
Pocket vs. Facebook, Twitter and Google Plus
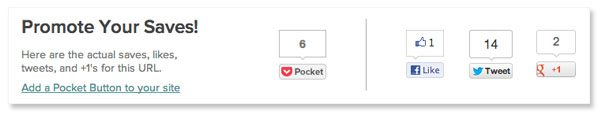
What is it? For each individual article, Pocket provides an overall comparison between total saves and social shares.
What can we learn? This is an opportunity to analyze how your audience actually consumes content. Do they read it and then like, tweet or plus one? Or are they moving toward the “defer” model, where they find something interesting and tuck it away for later? For lonelybrand, the number of Pockets is often higher than likes or +1s. We’ll keep an eye on this comparative data, and if the save-for-later trend continues, we might need to reassess how we invite visitors to interact with our content.